机器学习:sklearn实现基于Airbnb数据集的实验
本文共 8099 字,大约阅读时间需要 26 分钟。
五
Airbnb数据集-价格因素分析
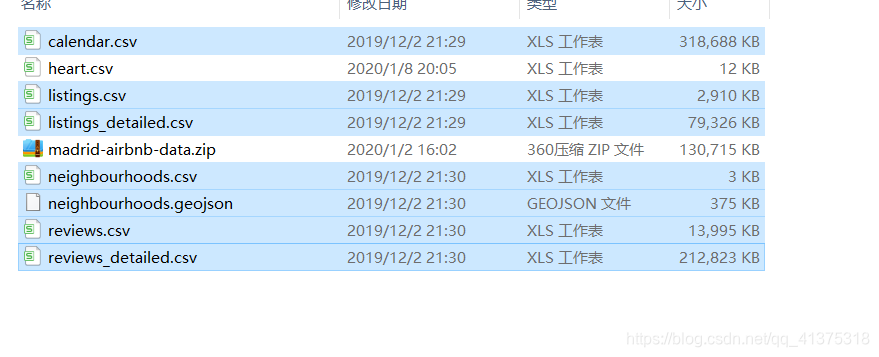
import pandas as pdimport numpy as npimport matplotlib.pyplot as pltimport seaborn as snscalendar = pd.read_csv("./data/madrid-airbnb-data/calendar.csv")calendar.head() 
calendar['price'] = calendar['price'].str.replace(r"[$,]","",regex=True).astype(np.float32)calendar['adjusted_price'] = calendar['adjusted_price'].str.replace(r"[$,]","",regex=True).astype(np.float32)
calendar['date'] = pd.to_datetime(calendar['date'])calendar['date'].head()

calendar['weekday'] = calendar['date'].dt.weekdaycalendar['month'] = calendar['date'].dt.monthcalendar['month'].head()

month_price = calendar.groupby("month")['price'].mean()sns.barplot(month_price.index,month_price.values) 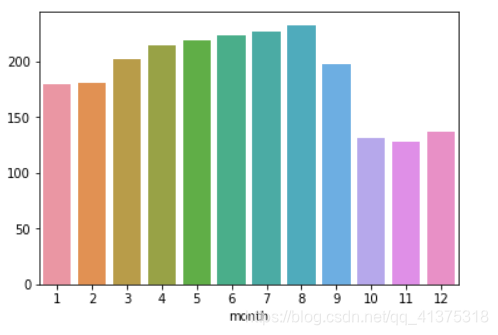
weekday_price = calendar.groupby("weekday")['price'].mean()sns.barplot(weekday_price.index,weekday_price.values) 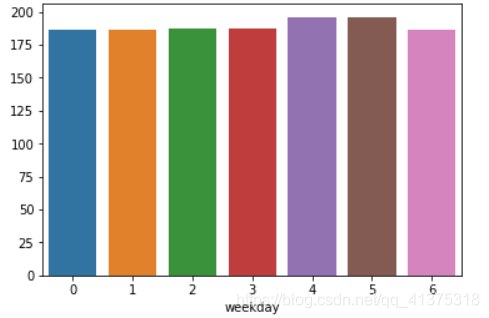
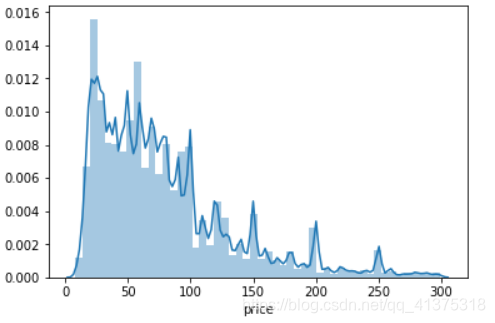
sns.distplot(calendar[calendar['price']<300]['price'])
Airbnb数据集-房屋数据预处理
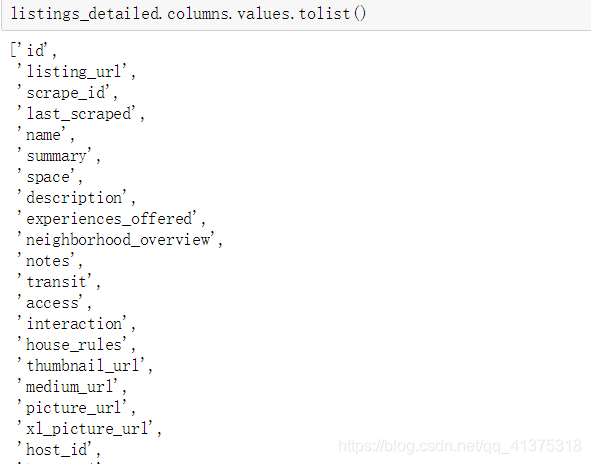
listings_detailed = pd.read_csv("./data/madrid-airbnb-data/listings_detailed.csv") listings_detailed.columns.values.tolist()
listings_detailed['price'] = listings_detailed['price'].str.replace(r"[$,]","",regex=True).astype(np.float32)listings_detailed['cleaning_fee'] = listings_detailed['cleaning_fee'].str.replace(r"[$,]","",regex=True).astype(np.float32)
listings_detailed['cleaning_fee'].fillna(0,inplace=True)listings_detailed['cleaning_fee'].head()

# 添加一个新的字段:最低消费listings_detailed['minimum_cost'] = (listings_detailed['price']+listings_detailed['cleaning_fee'])*listings_detailed['minimum_nights']listings_detailed['minimum_cost'].head()

# 设施的数量listings_detailed['n_amenities'] = listings_detailed['amenities'].str[1:-1].str.split(",").apply(len) # 根据可容纳的人数,添加一个新的列,用来表示类型:Single(1)、Couple(2)、Family(5)、Group(100)# accommodates/listings_detailed['accommodates_type'] = listings_detailed['accommodates_type'] = pd.cut(listings_detailed['accommodates'],bins=[1,2,3,5,100],include_lowest=True,right=False,labels=['Single','Couple','Family','Group'])
listings_detailed['neighbourhood_group_cleansed'].head()

listings_detailed['review_scores_rating'].head()

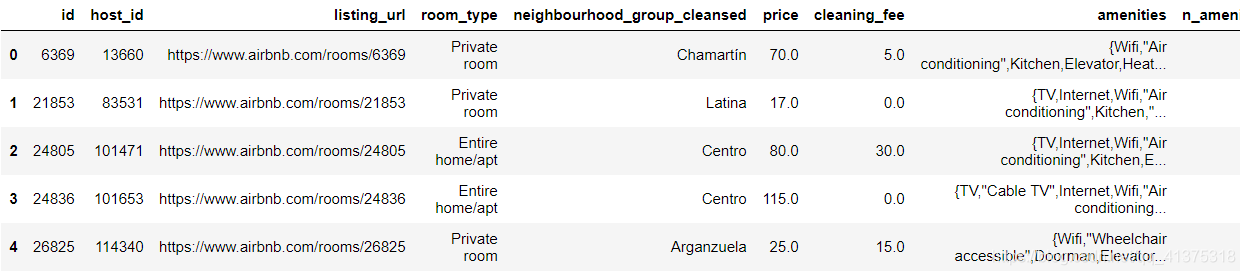
listings_detailed_df = listings_detailed[['id','host_id','listing_url','room_type', 'neighbourhood_group_cleansed','price','cleaning_fee','amenities','n_amenities', 'accommodates','accommodates_type','minimum_nights','minimum_cost']]listings_detailed_df.head()
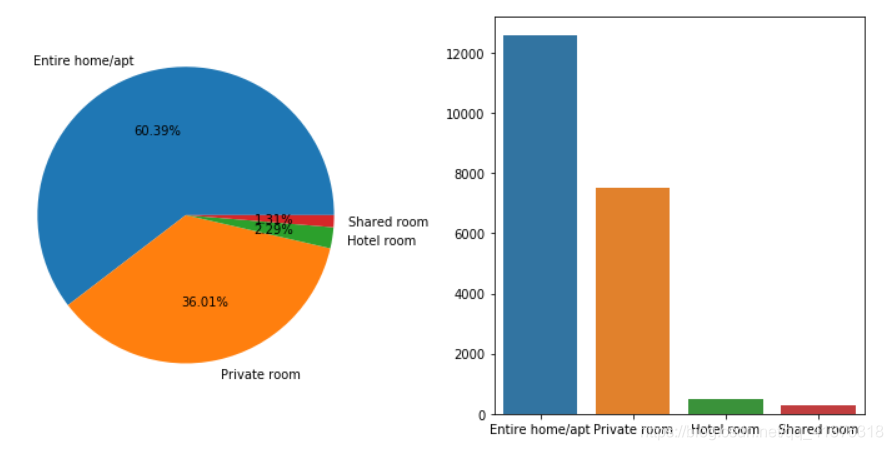
Airbnb数据集-房间类型和社区分析
# 房间类型的情况room_type_counts = listings_detailed_df['room_type'].value_counts()fig,axes = plt.subplots(1,2,figsize=(10,5))axes[0].pie(room_type_counts.values,autopct="%.2f%%",labels=room_type_counts.index)sns.barplot(room_type_counts.index,room_type_counts.values)plt.tight_layout()
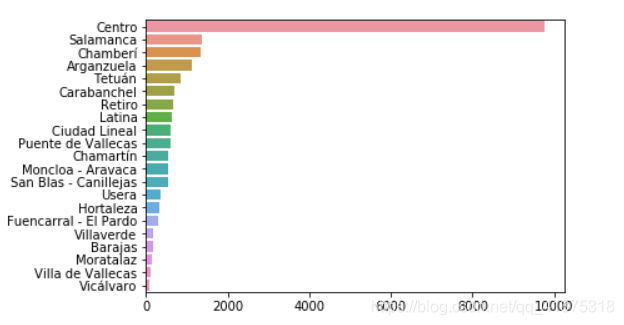
neighbourhood_counts = listings_detailed_df['neighbourhood_group_cleansed'].value_counts()sns.barplot(y=neighbourhood_counts.index,x=neighbourhood_counts.values,orient='h')
Airbnb数据集-房间类型和社区对比分析
neighbour_room_type = listings_detailed_df.groupby(['neighbourhood_group_cleansed','room_type']) \ .size() \ .unstack('room_type') \ .fillna(0) \ .apply(lambda row: row/row.sum(),axis=1) \ .sort_values("Entire home/apt",ascending=True)neighbour_room_type 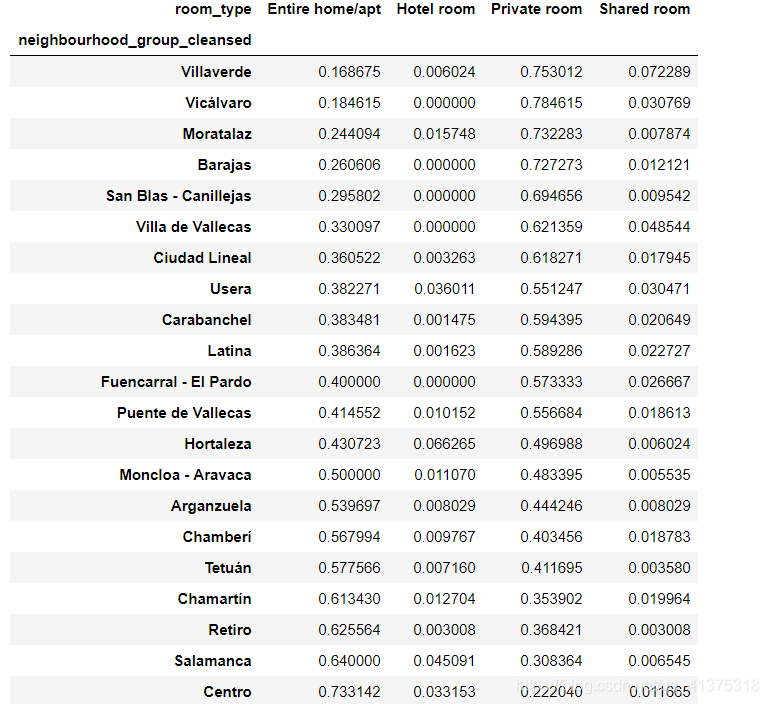
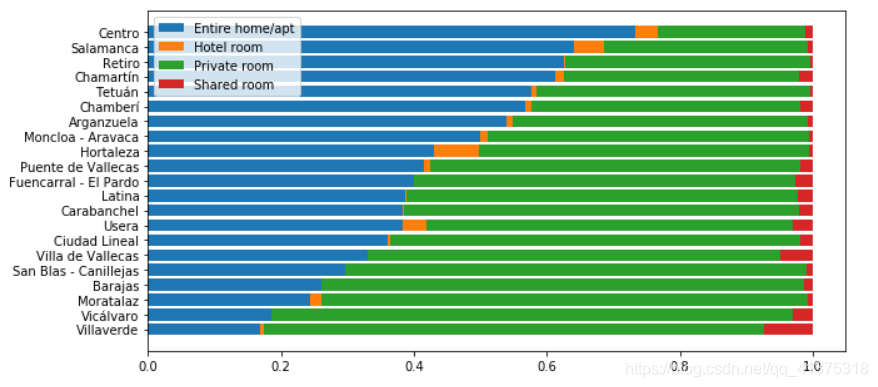
columns = neighbour_room_type.columnsplt.figure(figsize=(10,5))index = neighbour_room_type.indexplt.barh(index,neighbour_room_type[columns[0]])left = neighbour_room_type[columns[0]].copy()plt.barh(index,neighbour_room_type[columns[1]],left=left)left += neighbour_room_type[columns[1]].copy()plt.barh(index,neighbour_room_type[columns[2]],left=left)left += neighbour_room_type[columns[2]].copy()plt.barh(index,neighbour_room_type[columns[3]],left=left)plt.legend(columns)
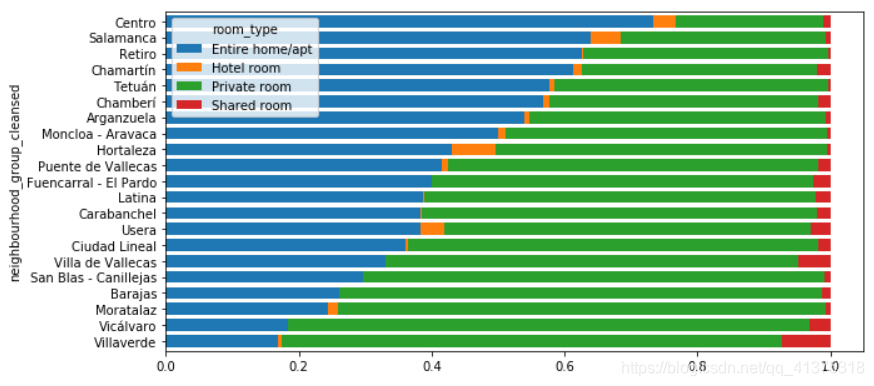
fig,ax = plt.subplots(figsize=(10,5))neighbour_room_type.plot(kind="barh",stacked=True,width=0.75,ax=ax)
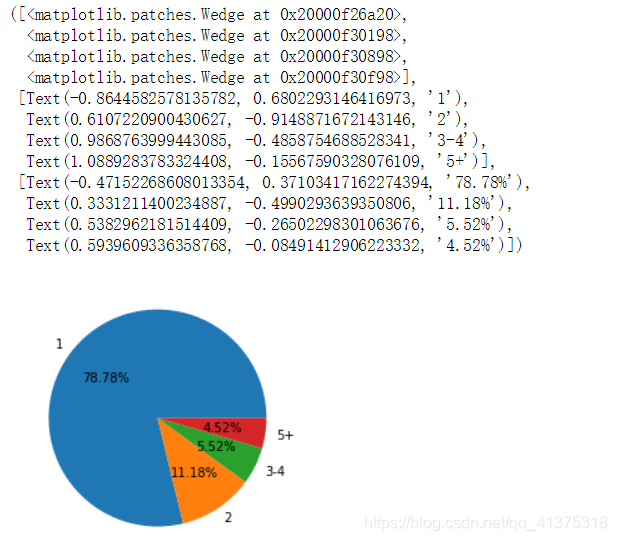
Airbnb数据集-房东房源数量分析
host_number = listings_detailed_df.groupby('host_id').size()sns.distplot(host_number[host_number<10]) 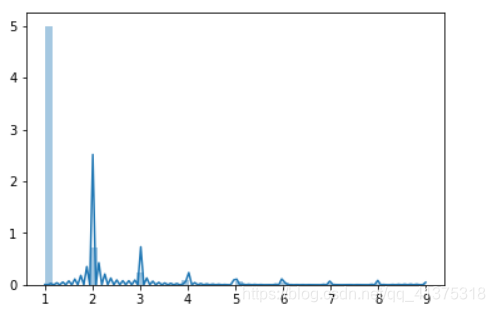
# 1,2,3,5+#[1,2),[2,3),[3,4),5+host_number_bins = pd.cut(host_number,bins=[1,2,3,5,1000],include_lowest=True,right=False,labels=['1','2','3-4','5+']).value_counts()plt.pie(host_number_bins,autopct="%.2f%%",labels=host_number_bins.index)
Airbnb数据集-评论数量与时间分析
reviews = pd.read_csv("./data/madrid-airbnb-data/reviews_detailed.csv",parse_dates=['date'])reviews.head() 
reviews['year'] = reviews['date'].dt.yearreviews['month'] = reviews['date'].dt.month
n_reviews_year = reviews.groupby("year").size()sns.barplot(n_reviews_year.index,n_reviews_year.values) 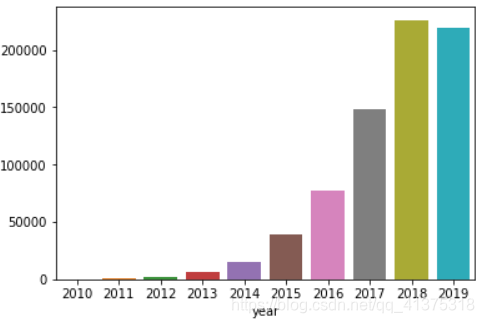
n_reviews_month = reviews.groupby("month").size()sns.barplot(n_reviews_month.index,n_reviews_month.values) 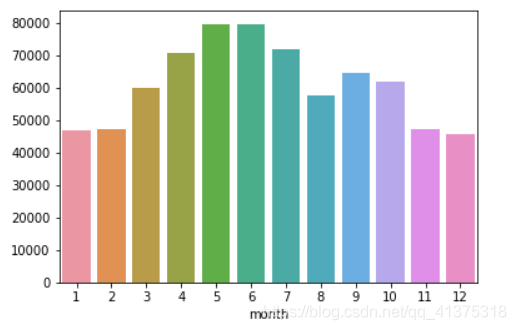
Airbnb数据集-评论数量与时间综合分析
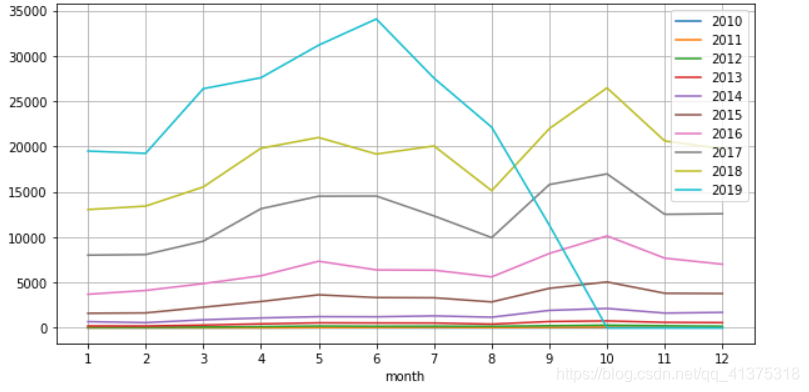
year_month_reviews = reviews.groupby(['year','month']).size().unstack("month").fillna(0)year_month_reviews 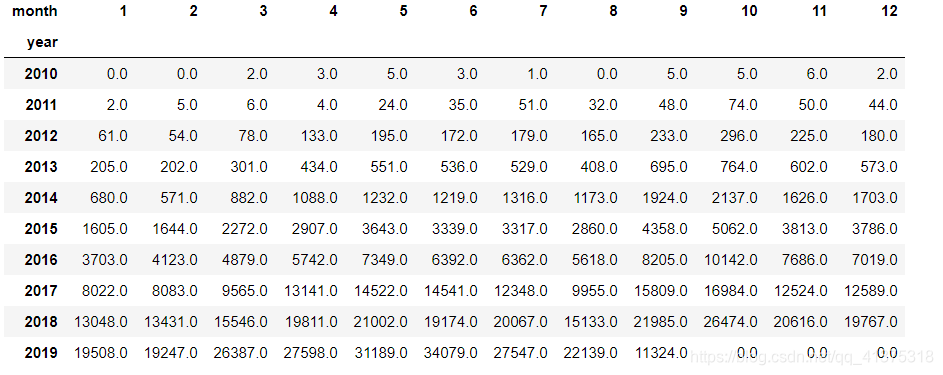
fig,ax = plt.subplots(figsize=(10,5))for index in year_month_reviews.index: series = year_month_reviews.loc[index] sns.lineplot(x=series.index,y=series.values,ax=ax)ax.legend(labels=year_month_reviews.index)ax.grid()_ = ax.set_xticks(list(range(1,13)))
'host_is_superhost','host_identity_verified','neighbourhood_group_cleansed','latitude','longitude','property_type','room_type','accommodates','bathrooms','bedrooms','cleaning_fee','minimum_nights','maximum_nights','availability_90','number_of_reviews','review_scores_rating','is_business_travel_ready','n_amenities','price'
Airbnb数据集-房屋价格预测(1)
from sklearn.preprocessing import StandardScalerml_listings = listings_detailed[listings_detailed['price']<300][[ 'host_is_superhost', 'host_identity_verified', 'neighbourhood_group_cleansed', 'latitude', 'longitude', 'property_type', 'room_type', 'accommodates', 'bathrooms', 'bedrooms', 'cleaning_fee', 'minimum_nights', 'maximum_nights', 'availability_90', 'number_of_reviews',# 'review_scores_rating', 'is_business_travel_ready', 'n_amenities', 'price']]# 删除异常值ml_listings.dropna(axis=0,inplace=True)# 分割特征值和目标值features = ml_listings.drop(columns=['price'])targets = ml_listings['price']# 针对离散型进行one-hot编码disperse_columns = [ 'host_is_superhost', 'host_identity_verified', 'neighbourhood_group_cleansed', 'property_type', 'room_type', 'is_business_travel_ready']disperse_features = features[disperse_columns]disperse_features = pd.get_dummies(disperse_features)# 对连续性数据进行标准化(因为特征值之间相差并不是很大,所以标准化的可能对预测结果影响不是很大)continuouse_features = features.drop(columns=disperse_columns)scaler = StandardScaler()continuouse_features = scaler.fit_transform(continuouse_features)# 对处理后的特征进行组合feature_array = np.hstack([disperse_features,continuouse_features])
Airbnb数据集-房屋价格预测(2)
from sklearn.model_selection import train_test_splitfrom sklearn.linear_model import LinearRegressionfrom sklearn.ensemble import RandomForestRegressorfrom sklearn.metrics import mean_absolute_error,r2_scoreX_train,X_test,y_train,y_test = train_test_split(feature_array,targets,test_size=0.25)regressor = RandomForestRegressor()regressor.fit(X_train,y_train)y_predict = regressor.predict(X_test)print("平均误差:",mean_absolute_error(y_test,y_predict))print("R2评分:",r2_score(y_test,y_predict)) 
Airbnb数据集-评论数量预测
ym_reviews = reviews.groupby(['year','month']).size().reset_index().rename(columns={ 0:"count"})features = ym_reviews[['year','month']]targets = ym_reviews['count']# X_train,X_test,y_train,y_test = train_test_split(features,targets,test_size=0.25)# regressor = RandomForestRegressor(n_estimators=100)# regressor.fit(X_train,y_train)# y_predict = regressor.predict(X_test)# print("平均误差:",mean_absolute_error(y_test,y_predict))# print("R2评分:",r2_score(y_test,y_predict)) regressor = RandomForestRegressor(n_estimators=100)regressor.fit(features,targets)y_predict = regressor.predict([ [2019,10], [2019,11], [2019,12]])y_predict

Airbnb数据集-预测结果可视化
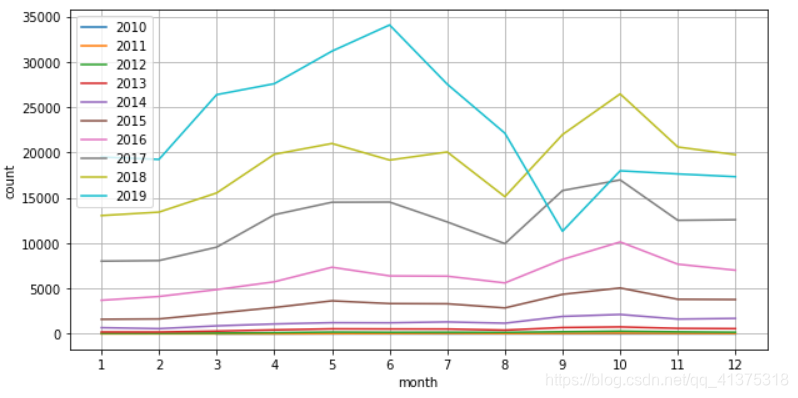
predict_reviews = pd.DataFrame([[2019,10+index,x] for index,x in enumerate(y_predict)],columns=['year','month','count'])final_reviews = pd.concat([ym_reviews,predict_reviews]).reset_index()years = final_reviews['year'].unique()fig,ax = plt.subplots(figsize=(10,5))for year in years: df = final_reviews[final_reviews['year']==year] sns.lineplot(x="month",y='count',data=df)ax.legend(labels=year_month_reviews.index)ax.grid()_ = ax.set_xticks(list(range(1,13)))
转载地址:http://mzdtz.baihongyu.com/
你可能感兴趣的文章